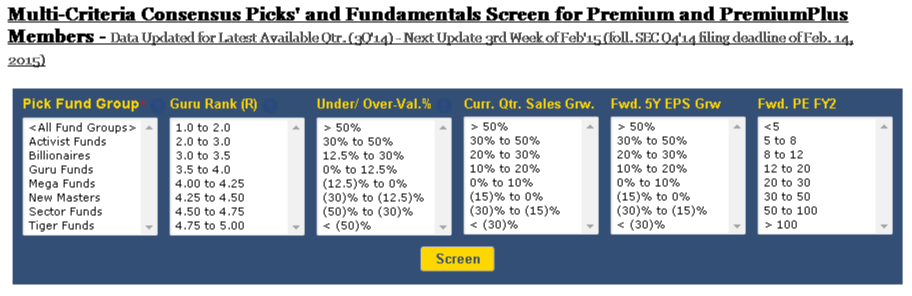
Multi-Criteria Consensus Picks’ & Fundamentals Screener (Q3/2016)
By 78 Guru, 27 Mega, 165 Sector-Foc., 59 Billionaires, 54 New Masters, 40 Tiger & 52 Activist Fund Mgrs.
Links: ✱Industry Top Picks ✱Multicriteria CP ✱Portfolio Check ✱All Stock Data At A Glance ✱SC 13D/G Archive ✱Multi-Qtr. CP
2Members can screen for stocks by Fund Group that fits their criteria for GuruRank®, Valuation, Sales & Fwd. EPS Growth, and Fwd. P/E Ratio.
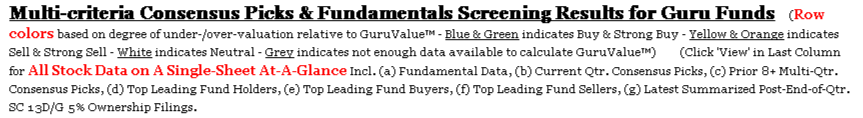
3The sample report below the screening tool is an example of the Consensus Picks’™ data available in the report generated with the tool.
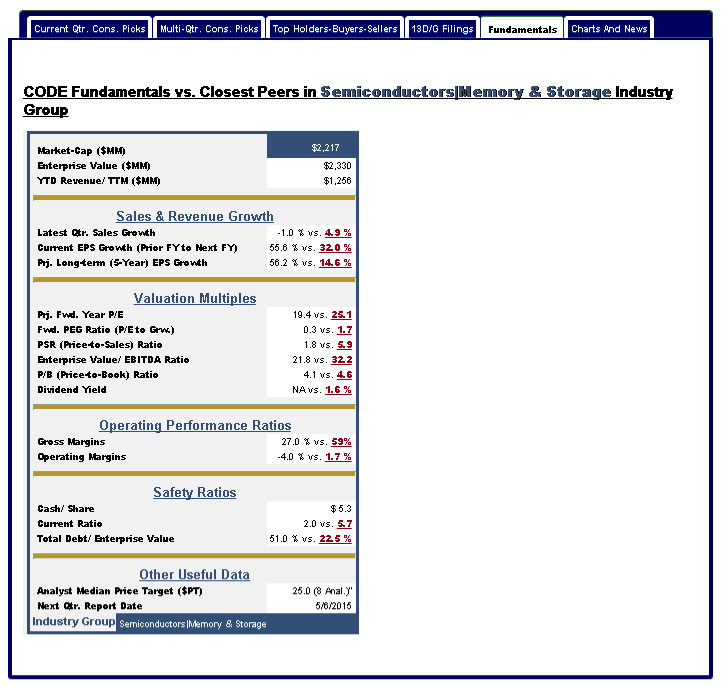
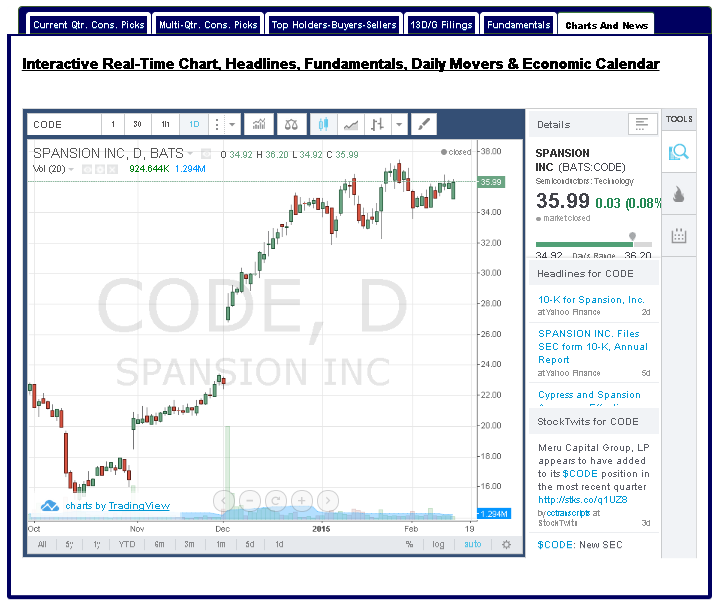
4Premium Members also get access to an All-Stock-Data-At-A-Glance Page for each of over 6,300+ stocks. The images below the sample report illustrate all detailed stock data on the ‘At-A-Glance’ page, that can be accessed by clicking ‘View’ in the last column of the report.
4Click here to navigate to our Consensus Picks Tools subscription page.
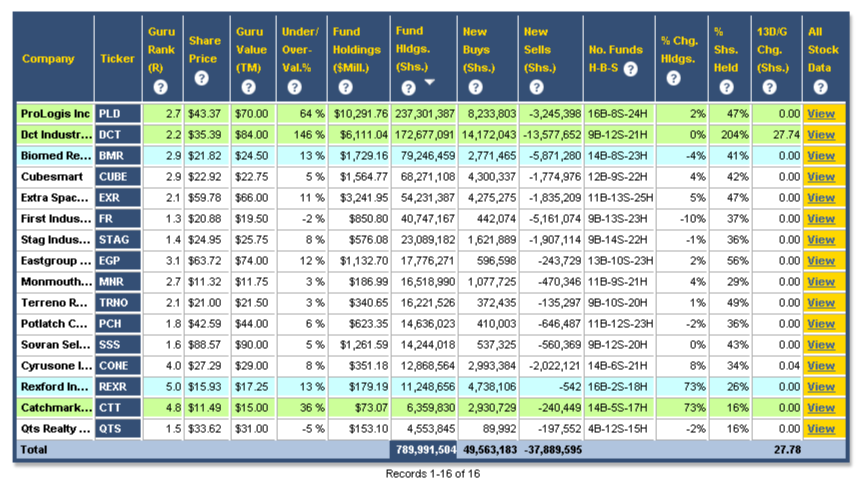
GuruRank®, our proprietary & relative stock ranking system rating on a 1-to-5 scale the attractiveness of each of over 6,300 stocks to Wall St.’s top 330+ leading fund managers – 1.0 being the least attractive & 5.0 being the most attractive. In our testing, stocks rated at the top, 4-4.5 and above, representing generally those that large numbers of leading fund managers have been accumulating, have consistently outperformed those ranked at the bottom.
GuruValue™, our proprietary & relative ‘dynamic’ stock valuation system, can be thought of as similar to an analyst consensus target price, but in this case more like the consensus target price of Wall St.’s top fund managers, implied by their latest buying & selling, combined with a host of proprietary fundamental and technical indicators. The price is dynamic, updated daily, and as such factors in the our latest intelligence on a variety of input parameters.
Rows are colored green, blue, yellow & orange based on the degree of under/over-valuation of each stock relative to its current GuruValue™.
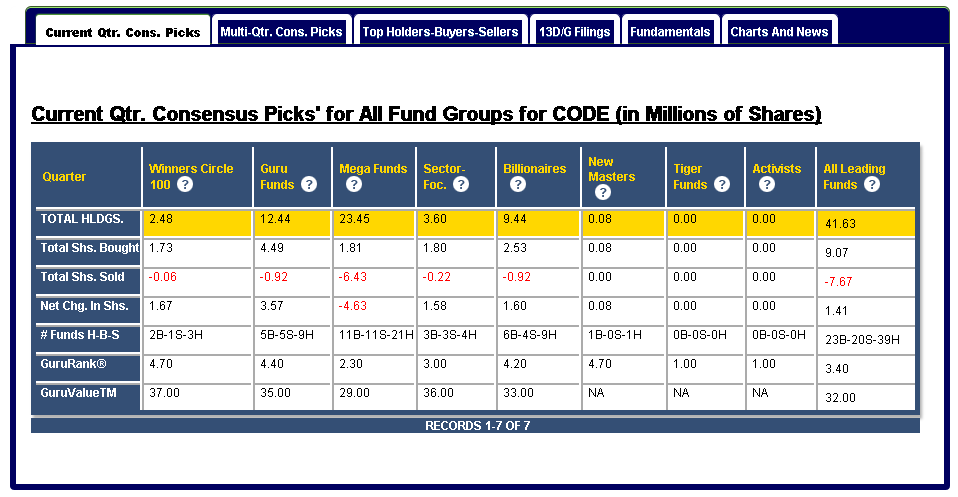
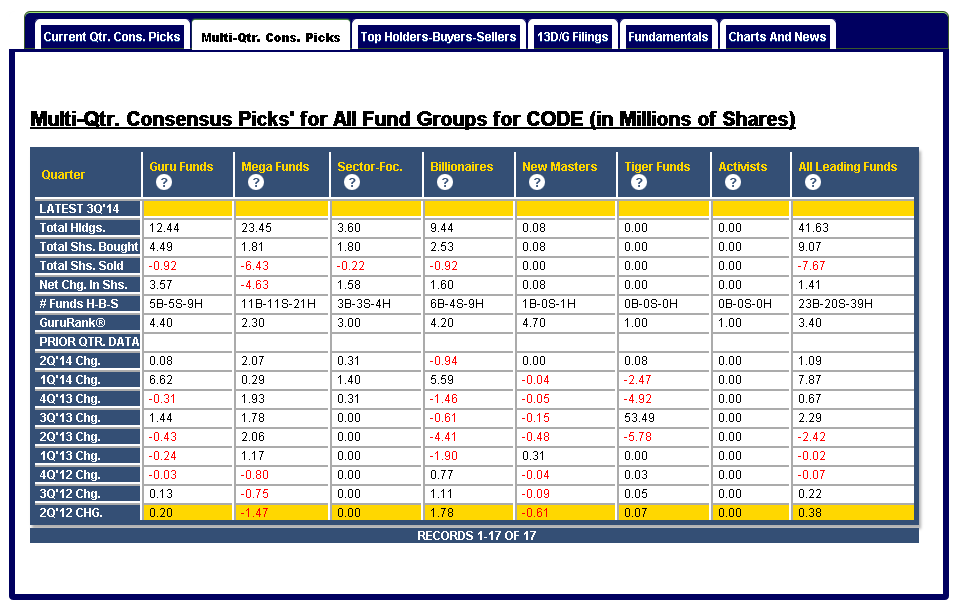
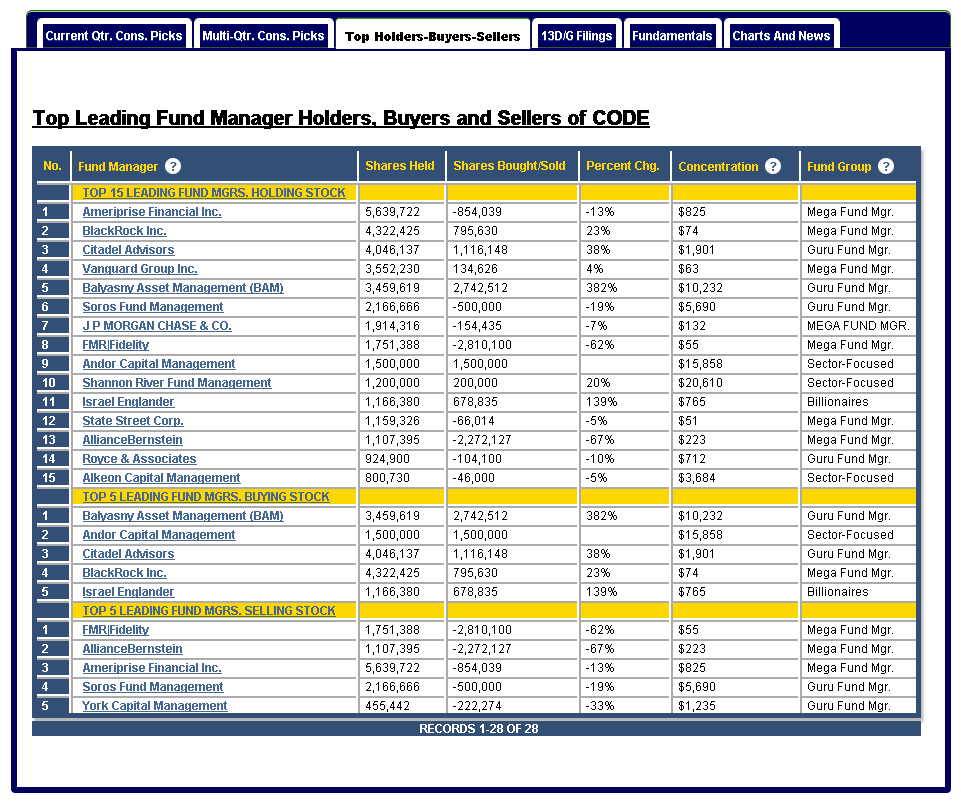
Latest quarter consensus or aggregate data in terms of fund Holdings, new buys, new sells, and the number of funds holding, buying and selling shares, provide the underlying data that informs us on what these leading fund managers are bullish or bearish about. In our experience, it is far more informative and profitable to know what these fund managers bought in aggregate or consensus than it is to know what one or two of them did individually.
Percent indicators in terms of percent change in holdings vs. prior quarter, and the percent outstanding shares held, provide additional indicators on the sentiment of top fund managers towards these stocks.
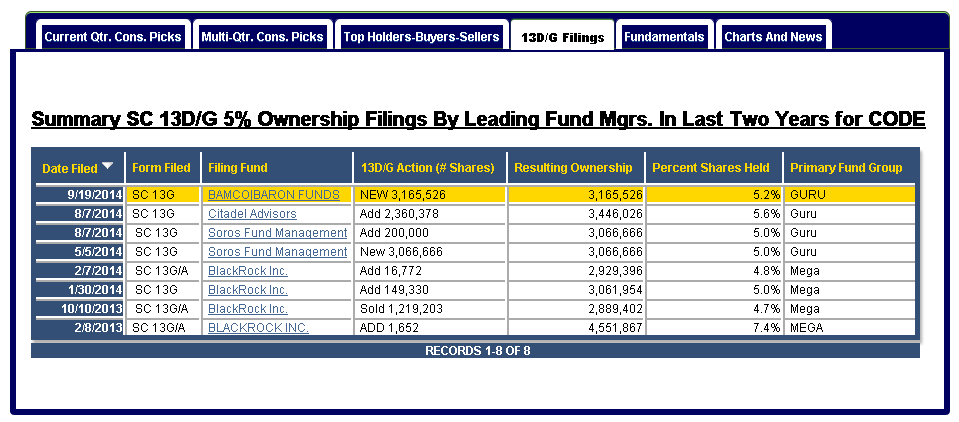
Latest 13D/G filings, post-EOQ, aggregated for each stock, gives us critical information on the latest moves by leading funds in each stock, given that these are required within 10 days after a fund acquires a beneficial ownership of more than 5% in the stock.
Sorting and Aggregation: All columns are sortable by clicking on the header, and aggregated data in the bottom row of the table for total new buys, new sells, holdings and latest 13D/G moves, give an indication of leading funds sentiment towards the whole industry sub-group.
Clicking on View in the last column gives Premium Members access to a whole host of fundamental, summary current and prior archived multi-quarter consensus picks data for all seven fund groups, as well as access to latest news & charts, and the top leading fund holders, buyers & sellers of that stock, for each of over 6,300+ stocks included in our database that are owned by these top funds. The available data is illustrated in the snapshot images below.